
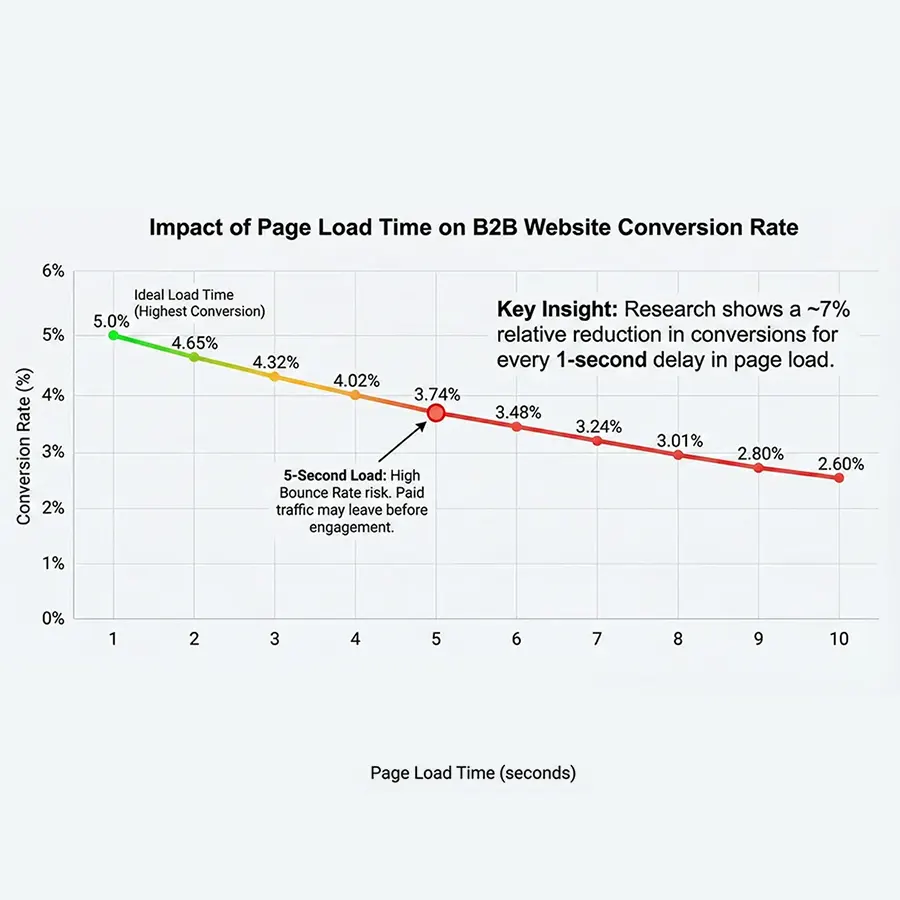
In the B2B world, speed isn’t just a metric; it is revenue.
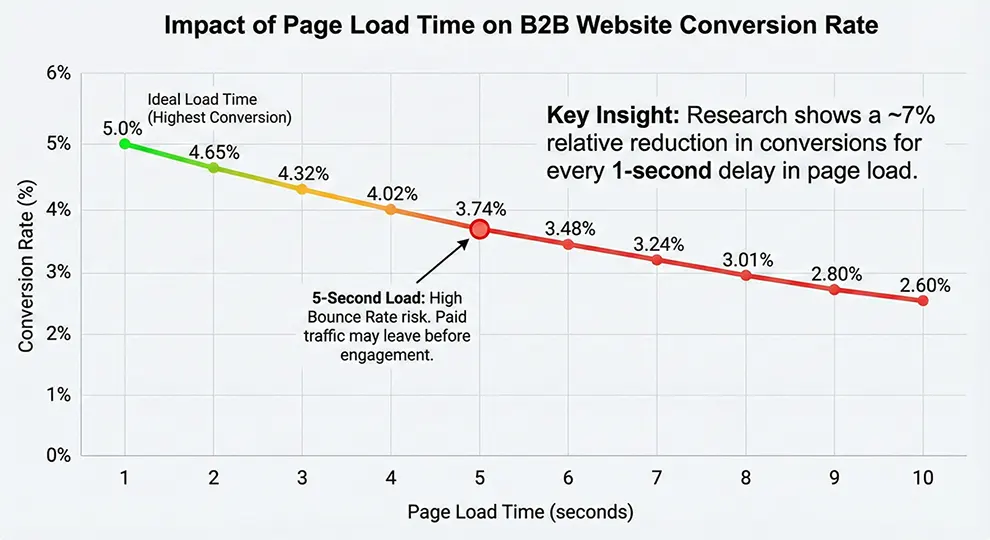
Research consistently shows that a 1-second delay in page load time results in a 7% reduction in conversions. If your B2B website takes 5 seconds to load, your expensive Google Ads traffic is bouncing before they even read your headline.
Many business owners and marketing managers are quick to blame the platform, claiming that “Elementor creates bloated code.” But this is a myth. Often, Elementor isn’t the problem—unoptimized configuration is.
We have built high-performance Elementor sites that score 90+ on mobile. In this guide, we will move beyond generic advice and dive into the specific protocols needed to pass Google’s Core Web Vitals in 2026.
Step 1: The Diagnosis (Measuring What Matters)
You cannot fix what you do not measure. Before touching a single plugin, you need to understand how Google views your site.
Do not rely on your own browser cache. Use Google PageSpeed Insights (PSI) for an objective assessment. Focus specifically on these three Core Web Vitals:

- LCP (Largest Contentful Paint): How long it takes for the main content (usually your hero banner) to load. Target: Under 2.5 seconds.
- INP (Interaction to Next Paint): How quickly the site reacts when a user clicks a button. Target: Under 200 milliseconds.
- CLS (Cumulative Layout Shift): Does the text or layout “jump” while loading? This creates a poor user experience. Target: 0.1 or less.
Step 2: The “Bloat” Culprits (Why It’s Happening)
If your site is sluggish, it is likely due to one of these four infrastructure bottlenecks:
1. Cheap Shared Hosting (The #1 Killer)
If you are paying $5/month for hosting (e.g., some inexpensive shared hosting plans), you are sharing server resources with thousands of other websites. High TTFB (Time to First Byte) means the server takes too long to even start sending data. No amount of plugin optimization can fix a bad server.
2. Unoptimized Media Assets
B2B sites often feature high-resolution images of industrial products or team photos. Uploading a 5MB PNG file directly to your media library is catastrophic for mobile loading speeds.
3. DOM Depth (The Legacy Elementor Issue)
“DOM Depth” refers to the number of HTML tags nested inside each other. Older Elementor sites often used nested Sections and Columns, creating complex code structures that confuse browsers.
4. Script Overload
Are you loading a heavy contact form script on a blog post that doesn’t have a form? This is called “unused CSS/JS,” and it drags down your performance scores.
Step 3: The Optimization Protocol (Actionable Fixes)
Here is the exact stack we use at CHCZ Digital to ensure our clients’ websites load instantly.
1. Upgrade Your Infrastructure
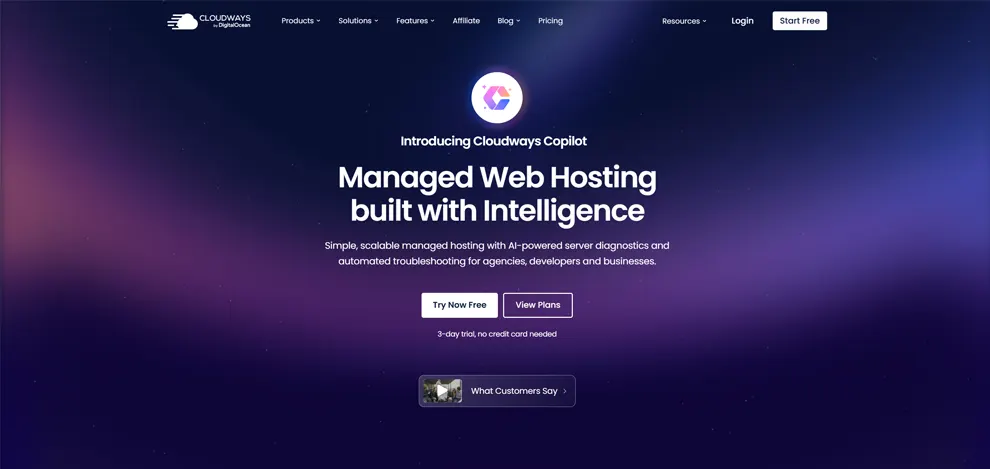
Stop treating hosting as a commodity. Move to Managed Cloud Hosting. We recommend Cloudways or SiteGround (Google Cloud Platform). These providers use NGINX servers and Object Caching (Redis/Memcached), which are essential for handling dynamic Elementor content.
2. Implement a Caching Strategy (WP Rocket)
You need a caching plugin to serve static HTML files instead of generating pages dynamically for every visitor. WP Rocket is the industry standard.
- Crucial Setting: Enable “Delay JavaScript Execution.” This prevents heavy scripts (like chat widgets or tracking codes) from loading until the user actually interacts with the page, instantly improving your LCP score.
3. Elementor-Specific Tuning
Elementor has released powerful performance features recently. Ensure they are active:
- Go to Elementor > Settings > Features.
- Flexbox Container: Active (Reduces code bloat significantly compared to Sections).
- Optimize DOM Output: Active.
- Lazy Load Background Images: Active.
4. Use an Image Delivery Network
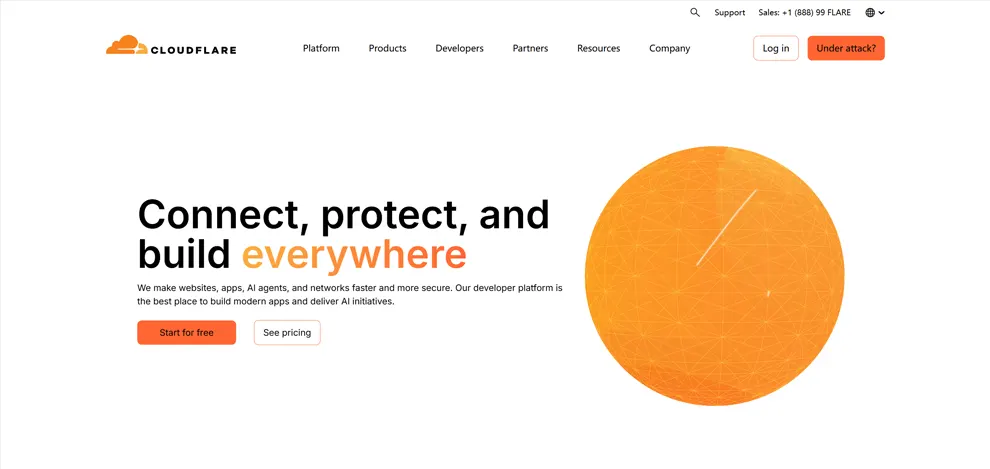
Never serve raw images. Use an image optimization tool like ShortPixel or an image CDN like Cloudflare. These tools automatically convert your heavy JPEGs into modern WebP or AVIF formats, reducing file size by up to 80% without losing quality.
Conclusion: Speed is a Competitive Advantage
Your website is the digital headquarters of your business. A slow site suggests a slow-moving company. By optimizing your infrastructure and configuring Elementor correctly, you not only improve your Google rankings but also build immediate trust with potential buyers.
Frequently Asked Questions
Does using Elementor hurt my website’s SEO rankings?
No. Elementor itself does not hurt SEO. The issue usually lies in how it is used. If you rely on cheap hosting, upload uncompressed images, or use too many third-party add-ons, your site will be slow. However, if configured correctly with a lightweight theme (like Hello Elementor) and proper caching, Elementor sites can score 95+ on PageSpeed Insights and rank at the top of Google.
How do I fix the “Largest Contentful Paint” (LCP) issue in Elementor?
LCP usually refers to your hero section (the top banner). To fix it:
- Preload the Hero Image: Use code or a plugin to tell the browser to load that image first.
- Convert to WebP: Ensure the image is less than 100KB.
- Delay JavaScript: Use a caching plugin to delay chat widgets or popups so they don’t compete with the hero image for bandwidth.
Why is my mobile score much lower than my desktop score?
This is normal but needs fixing. Mobile devices have slower processors (CPU) and rely on 4G/5G networks, making them more sensitive to heavy code. To fix this, use Elementor’s “Responsive Mode” to hide heavy elements (like video backgrounds or complex animations) on mobile devices and replace them with static images.